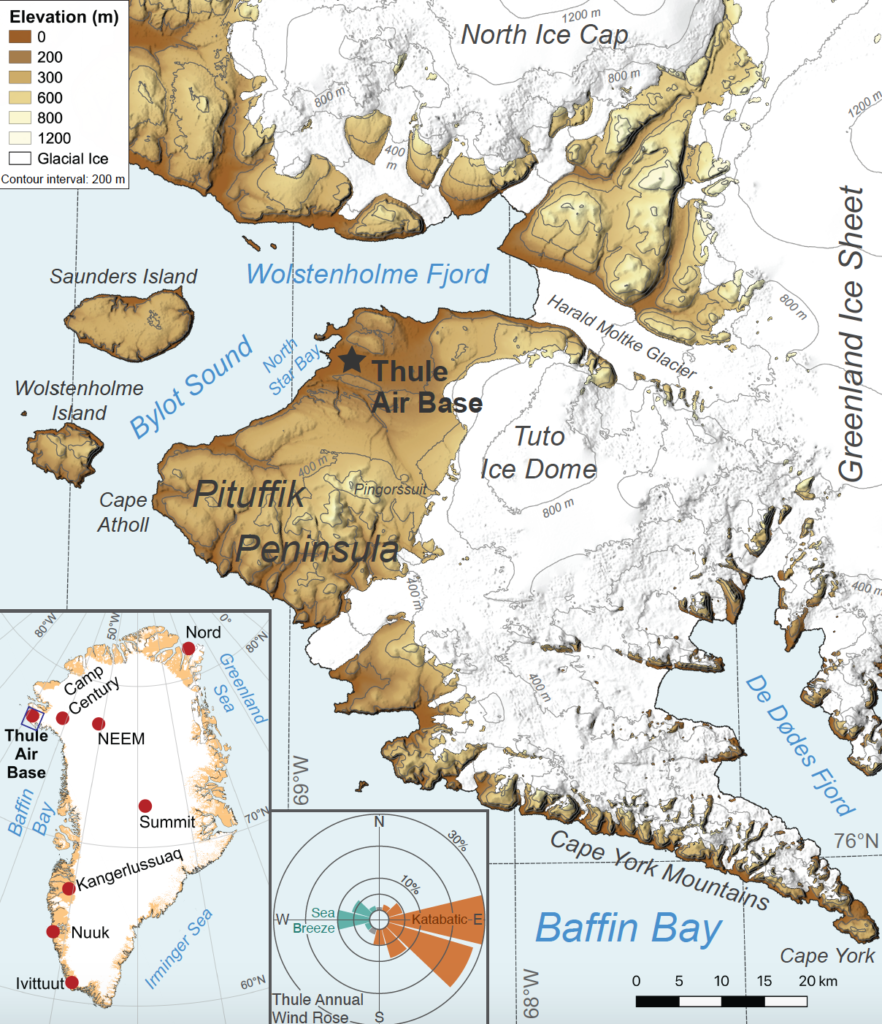
Northwest Greenland has one of the fastest changing climates on Earth, with regional warming driving massive ice loss through collapsing glaciers and surface melt of the ice sheet and permanent snow patches. At Pituffik Space Base (formerly Thule Air Base), I’ve worked with Jeff Welker, Ben Kopec, and many others to monitor the ongoing changes in the fragile tundra interface between the Greenland Ice Sheet and the Arctic Ocean.
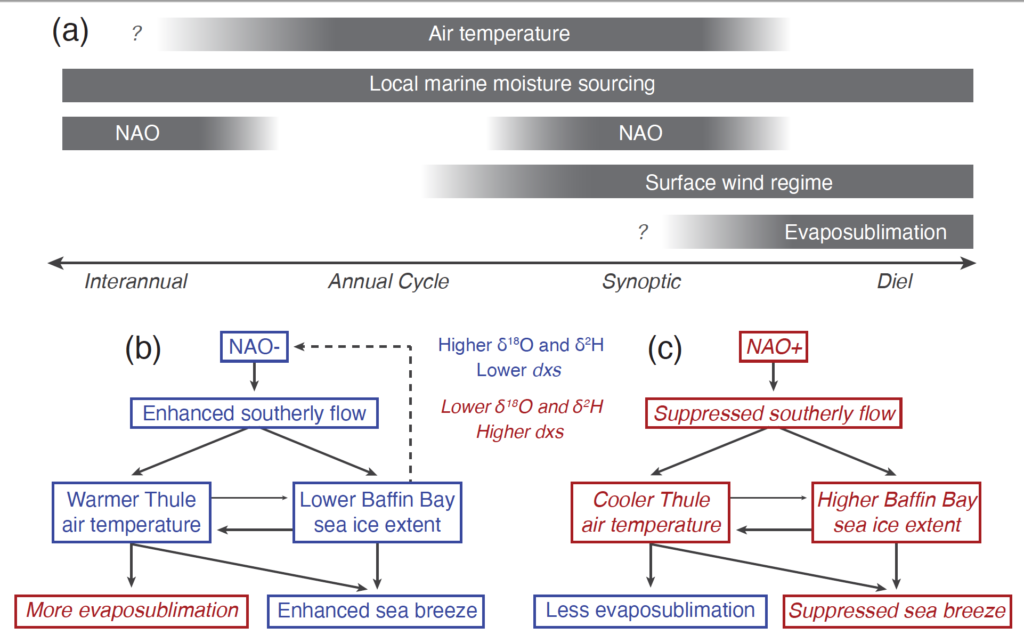
From 2017 to 2020, we continuously monitored the water vapor moving across the Pituffik landscape using a Picarro L2130-i water isotope analyzer. Using the oxygen and hydrogen isotopes of the water vapor, we can track changes in air mass origin and moisture sources as well as observe moisture coming off the Greenland Ice Sheet during major summer melts. The results of three years of water vapor isotopic monitoring were summarized in our 2020 paper that highlighted how sea ice extent and synoptic flow pattern controlled the variability of the isotopes in a complex, interacting system.
In addition to this water vapor monitoring, I initiated a surface water sampling project in summer 2018 where I sampled nearly all the lakes, ponds, and streams in the accessible Pituffik region. These samples are currently being analyzed for water isotopes and other chemistry to develop a ‘fingerprinted’ geochemical signature for each sample. By comparing the geochemical fingerprints, we hope to improve the understanding of local water connectivity and water quality issues.
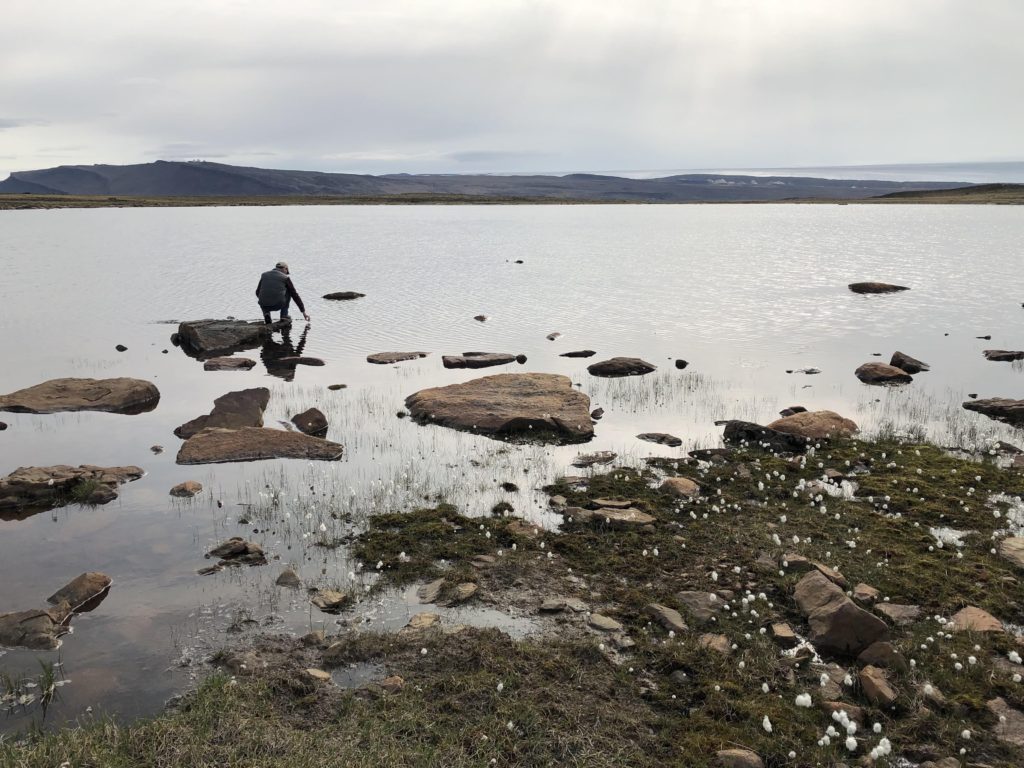
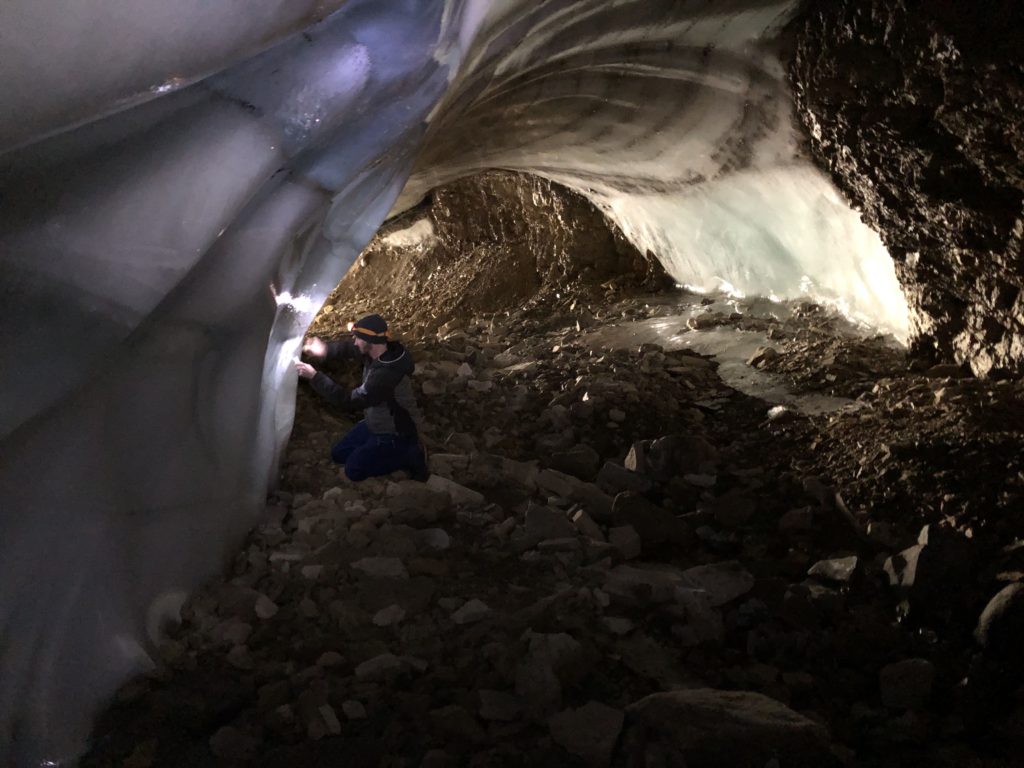
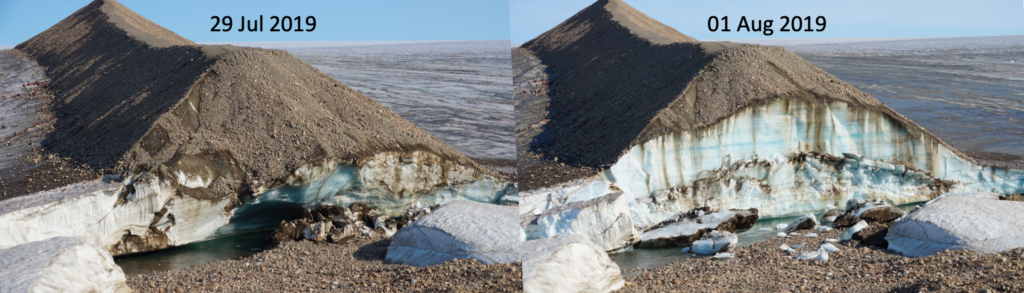
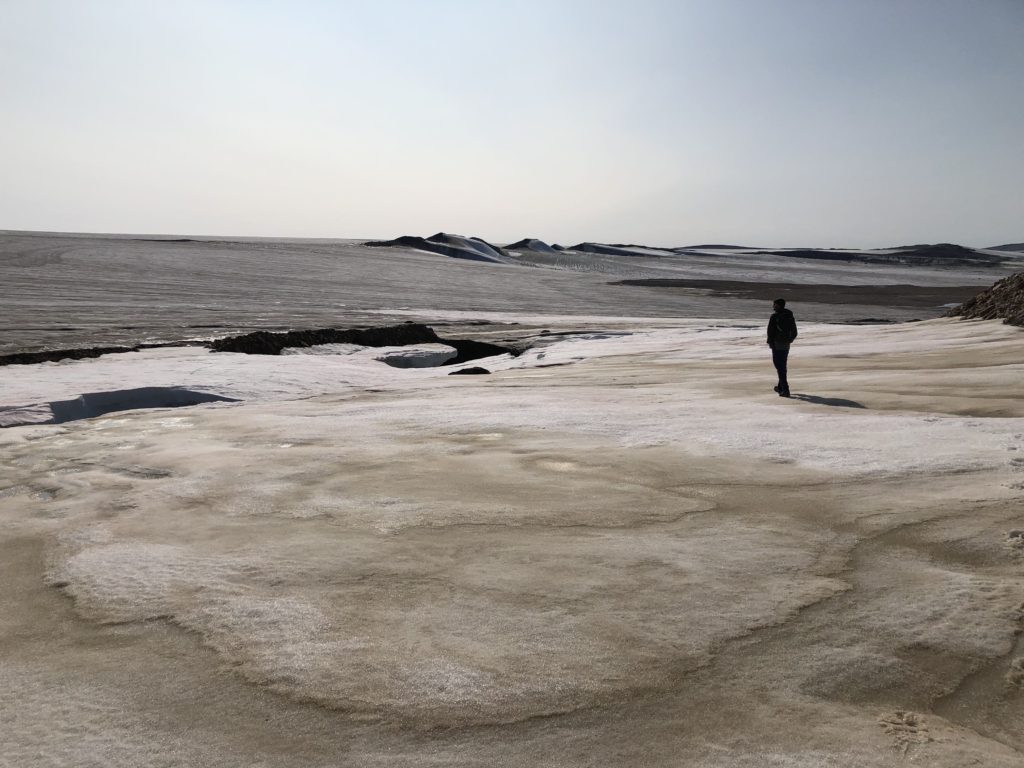
This set of samples was replicated and expanded in summer 2019. With long-term monitoring and repeated sampling, we can begin to tease out how the local hydrosphere responds to changes in climate. As an example, the 2019 melt season was longer and much warmer at its peak than 2018; in fact, we were sweating in T-shirts <100 m from the ice sheet edge while sampling in late July 2019! As a result, in 2019 there was much less residual snow pack, much earlier ice-free lakes, and dramatic collapses along the ice sheet margin.
As the tundra continues to thaw, the ice sheet retreats, and regional industry increases, changes to the local biogeochemical cycles and nutrient availability will no doubt alter the local ecology and geochemistry. We hope that these lake and stream samples will also provide a quantified geochemical baseline that future studies can use to compare the degree of change that has occurred.
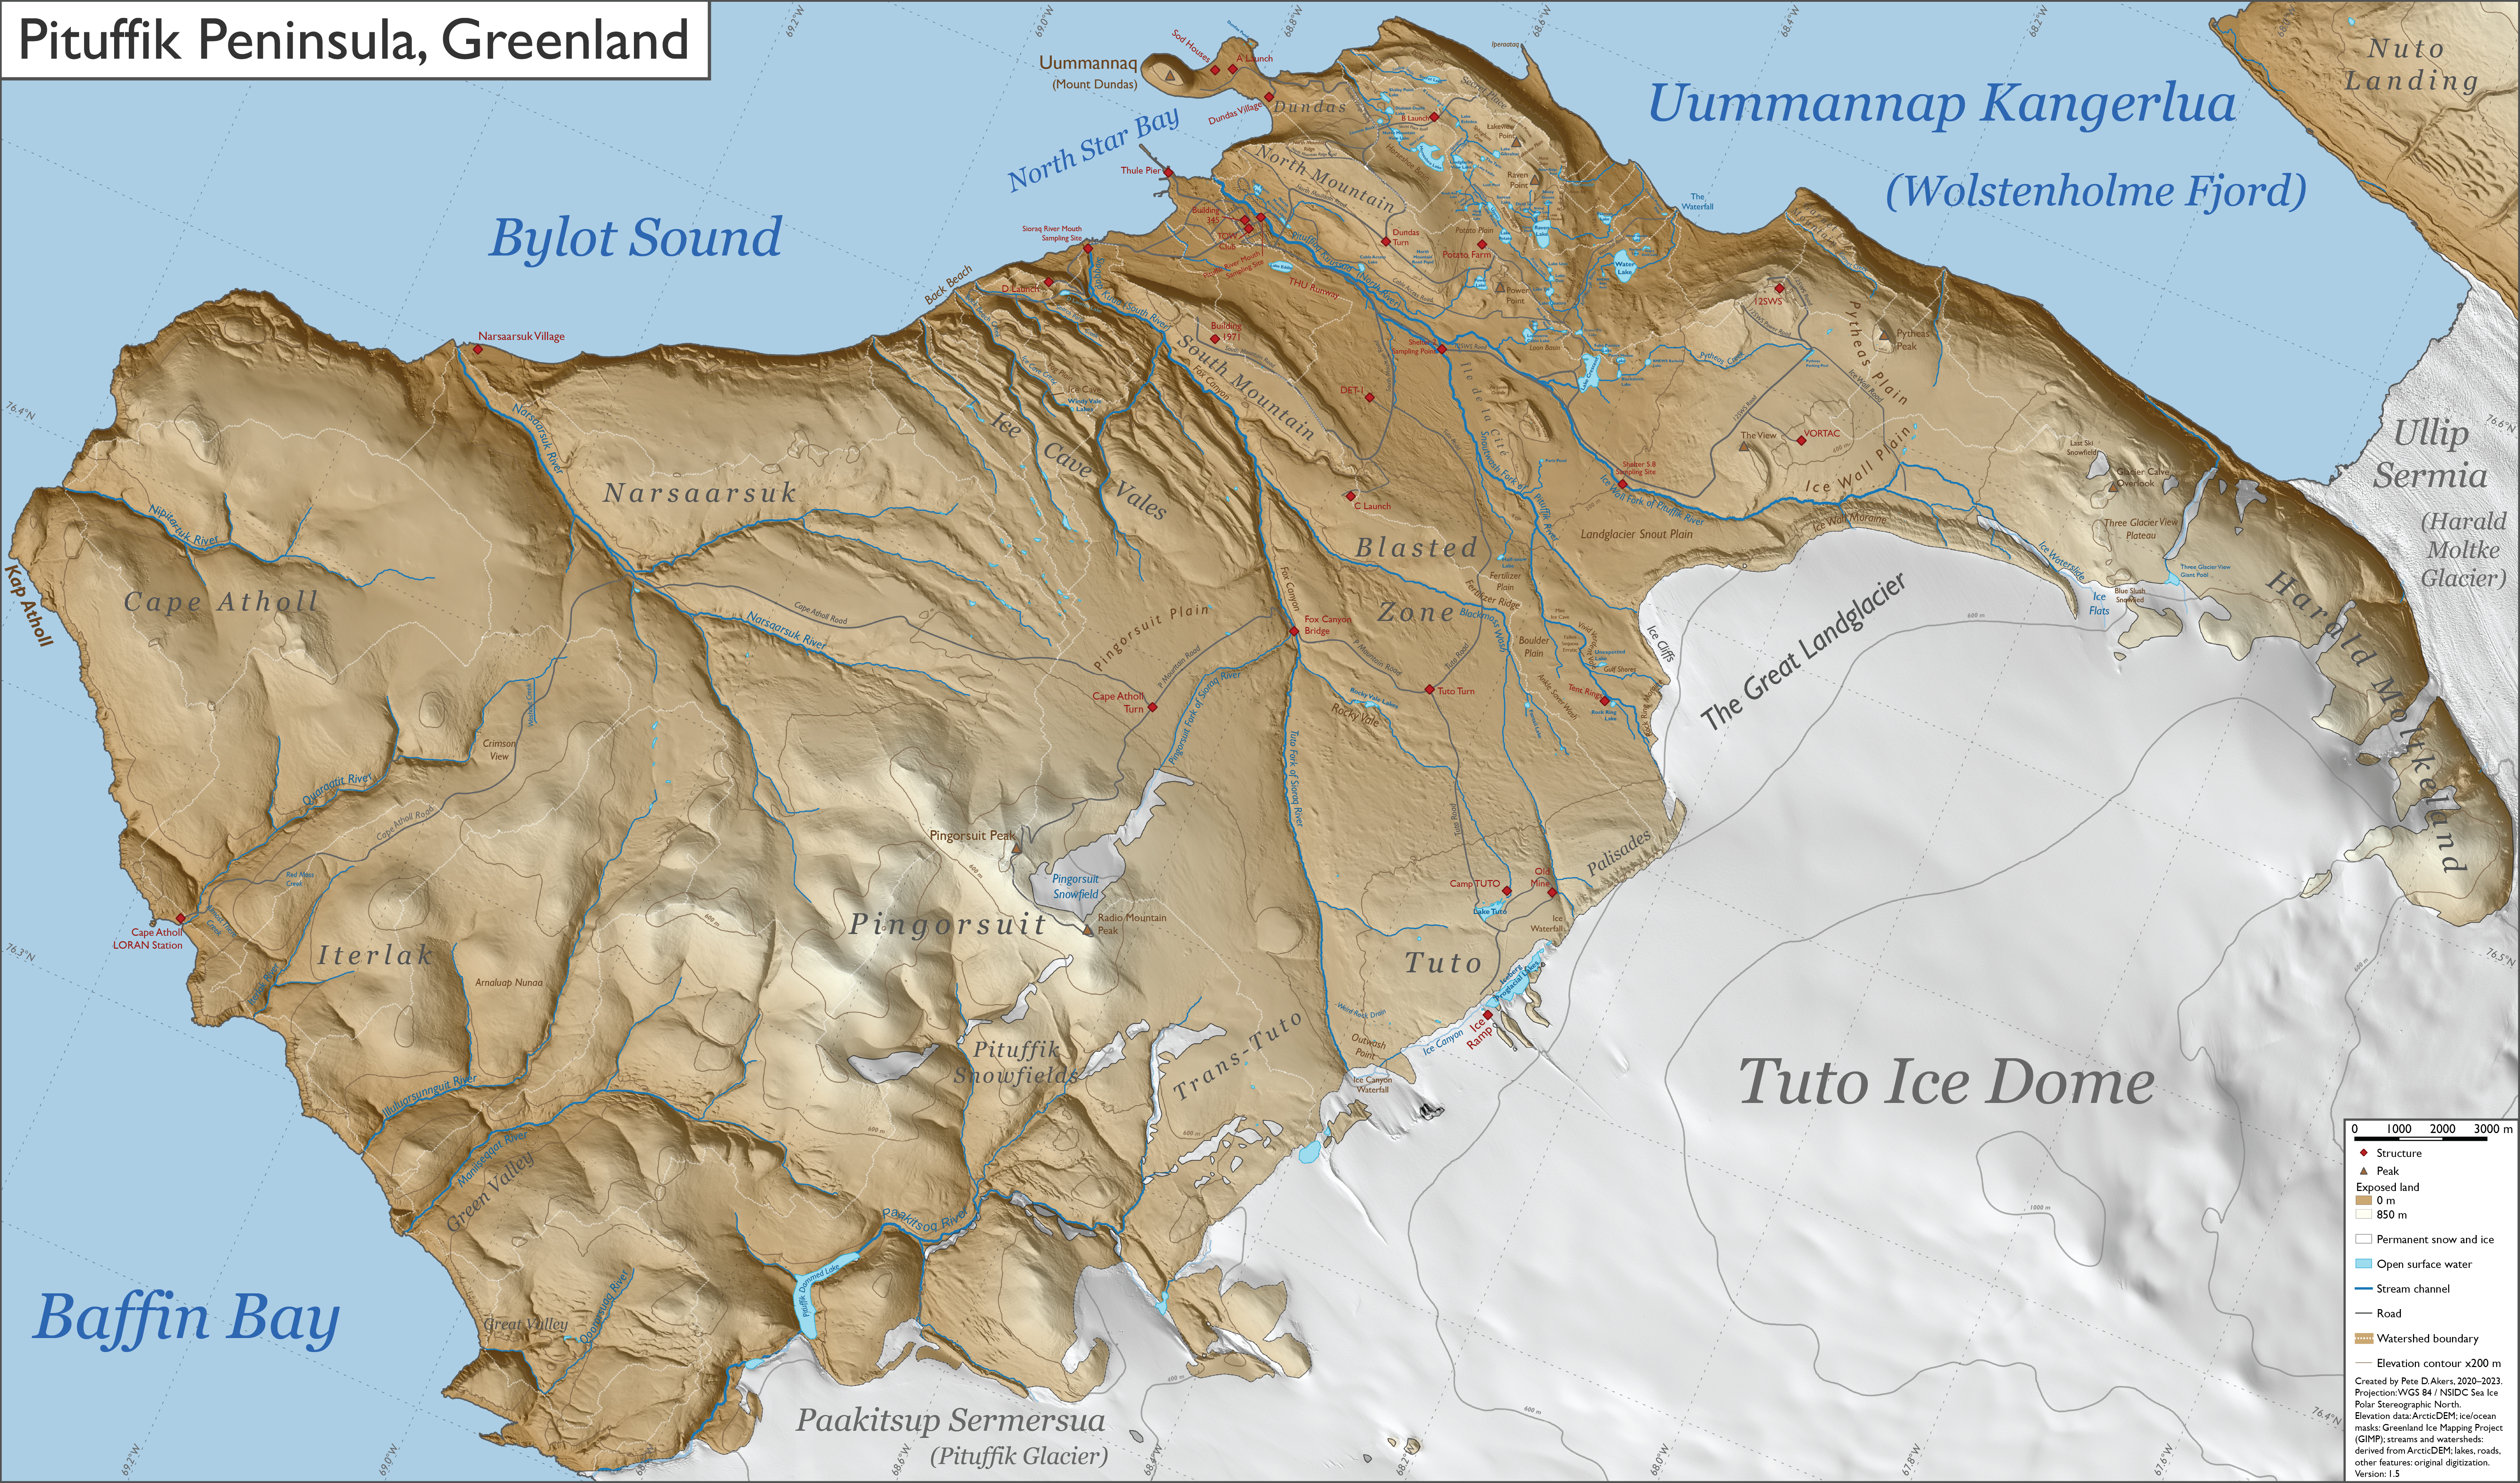
As part of my research in Pituffik, I created a highly detailed map and 15-page atlas of the region. Place names are a mix of indigenous names, locally known names, and personally assigned sampling site names. Click the links below to download the larger files.
